NRFI Results
First-inning leans for September 2, 2026, graded from final box scores.
All-time lean record
260-205
465 graded
56%
hit rate
NRFI
YRFI
0-0 on 8 leans
NRFI 0-0 · YRFI 0-0
NRFI Leans
5


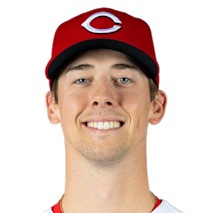
Casey Mize has kept the first inning clean in 95% of his 21 starts, which is the headline number here — and Brandon Williamson isn't far behind at 83% across six outings, with four scoreless firsts in his last five. Neither offense helps its own cause either: Cincinnati puts up a first-inning run just 26% of the time, San Diego 24%, third-fewest in the majors. Great American's 106 run factor is the lone counterweight, and the model still lands at 57% scoreless.
- NRFI lean — Casey Mize (95% NRFI) and Brandon Williamson (83%) have both buried the first inning, and neither lineup gets going early.
- Books price this NRFI at 0 (0% implied); the model has it 57%.
- The Cincinnati Reds score in the first in 26% of games, 25th-most in MLB, 29% against right-handers.
- The San Diego Padres score in the first in 24% of games, 29th-most in MLB, 32% against left-handers.


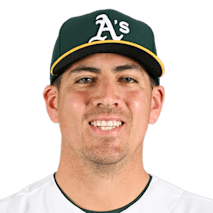
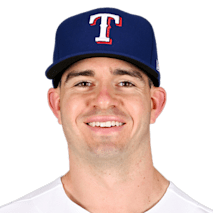
Jacob Lopez has kept the first inning clean in 89% of his 18 starts, and he's facing a Texas lineup that plates a first-inning run just 28% of the time — and only 22% against lefties. The counterweight is Cody Bradford, whose 60% NRFI rate across five starts is a thinner, shakier sample against an Oakland group that scores early 29% of the time versus southpaws. Globe Life's 94 run factor nudges it further toward quiet, but at 55% the lean is mild.
- NRFI lean — Jacob Lopez (89% NRFI) and Cody Bradford (60%) have both buried the first inning, and neither lineup gets going early.
- Books price this NRFI at -128 (53% implied); the model has it 55%.
- The Texas Rangers score in the first in 28% of games, 20th-most in MLB, 22% against left-handers.
- The Oakland Athletics score in the first in 28% of games, 18th-most in MLB, 29% against left-handers.




Landen Roupp has kept the first inning clean in 81% of his 26 starts, and he draws a Giants-friendly matchup against a San Francisco offense that only scores in the opening frame 26% of the time — 22% against righties. Bubba Chandler counters at 76% NRFI, though Pittsburgh's bats put up first-inning runs in 31% of games. PNC Park's 98 run factor nudges it further toward zeros.
- NRFI lean — Landen Roupp (81% NRFI) and Bubba Chandler (76%) have both buried the first inning, and neither lineup gets going early.
- Books price this NRFI at -117.5 (51% implied); the model has it 55%.
- The Pittsburgh Pirates score in the first in 31% of games, 10th-most in MLB, 36% against right-handers.
- The San Francisco Giants score in the first in 26% of games, 26th-most in MLB, 22% against right-handers.



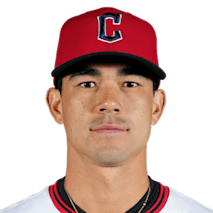
Toronto's bats have been the quietest in baseball in the opening frame — first-inning runs in just 23% of games, and only 16% against lefties, which is exactly what Joey Cantillo brings to the mound with a 70% NRFI mark across 27 starts. Dylan Cease counters at 67%, clean in four of his last five, inside a Progressive Field that plays six percent below average for runs. The model's 56% sits right on the book's 57%, so there's no real gap to exploit.
- NRFI lean — Dylan Cease (67% NRFI) and Joey Cantillo (70%) have both buried the first inning, and neither lineup gets going early.
- Books price this NRFI at -153.5 (57% implied); the model has it 56%.
- The Cleveland Guardians score in the first in 27% of games, 24th-most in MLB, 25% against right-handers.
- The Toronto Blue Jays score in the first in 23% of games, 30th-most in MLB, 16% against left-handers.




- NRFI lean — Yoshinobu Yamamoto has worked a scoreless first in 65% of his starts, the headline edge in a quiet matchup.
- Books price this NRFI at -135 (54% implied).
- The Los Angeles Dodgers score in the first in 30% of games, 14th-most in MLB.
- The St. Louis Cardinals score in the first in 30% of games, 15th-most in MLB, 25% against right-handers.
YRFI Leans
3

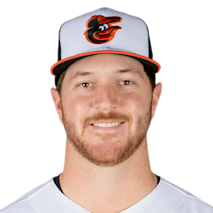

Coors Field's 128 run factor is doing a lot of the work here, and Tomoyuki Sugano isn't helping Colorado's case — he's kept the first inning clean in just 52% of his 23 starts and only twice in his last five. Trevor Rogers is the counterweight at 88% NRFI with five straight clean openers, but the Rockies plate a first-inning run 31% of the time, ninth-most in the majors. The lean is toward YRFI, narrowly.
- YRFI lean — Coors Field (run factor 128) is one of the league's most hitter-friendly parks, and the Colorado Rockies score early in 31% of games.
- Books price this NRFI at +114.5 (44% implied); the model has it 44%.
- The Colorado Rockies score in the first in 31% of games, 9th-most in MLB, 34% against left-handers.
- The Baltimore Orioles score in the first in 25% of games, 28th-most in MLB, 30% against right-handers.




Taylor Clarke opens for Arizona with no season starts to lean on, a blank slate against a Phillies lineup that scores in the first 33% of the time — fifth-most in MLB. Andrew Painter's 61% first-inning shutout rate over 18 starts is the counterweight, though he's managed it just twice in his last five. Add Chase Field's 106 run factor and the model's 46% scoreless edges under the book's 49%.
- YRFI lean — Chase Field (run factor 106) is one of the league's most hitter-friendly parks, and the Philadelphia Phillies score early in 33% of games.
- Books price this NRFI at -108 (49% implied); the model has it 46%.
- The Arizona Diamondbacks score in the first in 29% of games, 16th-most in MLB, 30% against right-handers.
- The Philadelphia Phillies score in the first in 33% of games, 5th-most in MLB, 27% against right-handers.


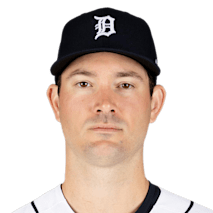

Drew Anderson hasn't allowed a first-inning run in any of his seven starts, which is exactly why this one gets interesting: he's staring down a Minnesota lineup that scores in the first 37% of the time, the highest rate in baseball. Dean Kremer's coin-flip 50% NRFI mark and Detroit's own 33% first-inning strike rate tilt things toward YRFI, with Target Field's 104 run factor nudging along. Model sees 44% scoreless against a 51% book number.
- YRFI lean — the Minnesota Twins push a first-inning run across in 37% of games (most in MLB), hard to keep off the board early.
- Books price this NRFI at -120 (51% implied); the model has it 44%.
- The Minnesota Twins score in the first in 37% of games, the most in MLB, 39% against right-handers.
- The Detroit Tigers score in the first in 33% of games, 4th-most in MLB, 34% against right-handers.
Coin Flips
7


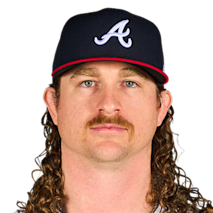

Grant Holmes has kept the first inning clean in 87% of his 23 starts, including all five of his last five, and Brad Lord sits at 75% through his four — yet the model still only lands on 52% scoreless. The reason is the bats: Washington and Atlanta both plate a run in the first 31% of the time, and Nationals Park plays slightly above average at a 102 run factor. Notably, the book's implied 3% NRFI sits wildly below that model number.
- Coin flip — Grant Holmes' 87% NRFI is the case for the under; the Washington Nationals' 31% first-inning bats (12th-most in MLB) are the case for the over.
- Books price this NRFI at -1.5 (3% implied); the model has it 52%.
- The Washington Nationals score in the first in 31% of games, 12th-most in MLB, 29% against right-handers.
- The Atlanta Braves score in the first in 31% of games, 13th-most in MLB, 30% against right-handers.




Bryce Miller and Patrick Sandoval both carry strong first-inning marks — 73% and 78% NRFI respectively — and Boston's bats have been quiet early, scoring in the first just 26% of the time and only 23% against righties. The catch is Fenway's 108 park factor and a Seattle lineup that puts up first-inning runs 31% of the time, which is why the model lands right at 50%, a shade under the book's 52%.
- Coin flip — Patrick Sandoval's 78% NRFI is the case for the under; the Seattle Mariners' 31% first-inning bats (11th-most in MLB) are the case for the over.
- Books price this NRFI at -127 (52% implied); the model has it 50%.
- The Boston Red Sox score in the first in 26% of games, 27th-most in MLB, 23% against right-handers.
- The Seattle Mariners score in the first in 31% of games, 11th-most in MLB, 31% against left-handers.




Griffin Jax has kept the first inning clean in 72% of his 18 starts, and he draws a Mets lineup that plates a run in the opening frame just 27% of the time — 23rd in MLB. The counterweight is Justin Hagenman, who hasn't started a game this season, so there's no track record against a Rays offense that scores first-inning runs at a 32% clip, sixth-most in baseball. Genuinely close to a toss-up.
- Coin flip — Griffin Jax's 72% NRFI is the case for the under; the Tampa Bay Rays' 32% first-inning bats (6th-most in MLB) are the case for the over.
- Books price this NRFI at -120 (51% implied); the model has it 52%.
- The Tampa Bay Rays score in the first in 32% of games, 6th-most in MLB, 31% against right-handers.
- The New York Mets score in the first in 27% of games, 23rd-most in MLB, 26% against right-handers.


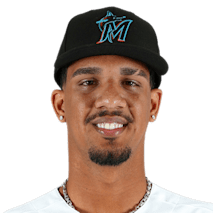

Noah Cameron has kept the first inning clean in 84% of his 25 starts, and Eury Perez isn't far behind at 74% — both arms enter riding 5-for-5 stretches in their last five. The pushback comes from Kansas City's bats, which put up a first-inning run in 31% of games, 8th-most in MLB, inside a Kauffman park factor of 102. The model's 52% scoreless read sits right on top of the book's 51%.
- Coin flip — Noah Cameron's 84% NRFI is the case for the under; the Kansas City Royals' 31% first-inning bats (8th-most in MLB) are the case for the over.
- Books price this NRFI at -119 (51% implied); the model has it 52%.
- The Kansas City Royals score in the first in 31% of games, 8th-most in MLB, 26% against right-handers.
- The Miami Marlins score in the first in 28% of games, 19th-most in MLB, 26% against left-handers.




Jacob Misiorowski has kept the first inning clean in 88% of his 24 starts, including all five of his last five — that's the kind of number that normally anchors a NRFI side. The problem is David Peterson on the other end, sitting at 47% and facing a Brewers lineup that plates a first-inning run 34% of the time against lefties. Wrigley's 94 run factor helps, but the model's 53% scoreless read is close enough to the book's 52% to call this a genuine coin flip.
- Coin flip — Jacob Misiorowski's 88% NRFI is the case for the under; the Milwaukee Brewers' 29% first-inning bats (17th-most in MLB) are the case for the over.
- Books price this NRFI at -127 (52% implied); the model has it 53%.
- The Chicago Cubs score in the first in 27% of games, 22nd-most in MLB, 27% against right-handers.
- The Milwaukee Brewers score in the first in 29% of games, 17th-most in MLB, 34% against left-handers.




Davis Martin has cleared the first inning in 74% of his 23 starts, but he's kept the board clean just once in his last five — and Houston strikes early more than almost anyone, plating a run in the opening frame 34% of the time. Hayden Wesneski pulls the other direction with five straight scoreless firsts, though that's off just six starts. The model's 49% NRFI sits right on the book's 50%.
- Coin flip — Hayden Wesneski's 83% NRFI is the case for the under; the Houston Astros' 34% first-inning bats (3rd-most in MLB) are the case for the over.
- Books price this NRFI at -113 (50% implied); the model has it 49%.
- The Houston Astros score in the first in 34% of games, 3rd-most in MLB, 37% against right-handers.
- The Chicago White Sox score in the first in 31% of games, 7th-most in MLB, 30% against right-handers.


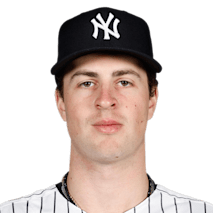

Cam Schlittler has kept the first inning clean in 85% of his 27 starts, and Reid Detmers has run off five straight scoreless openers — strong arms on both sides. The catch is the Angels lineup, which plates a first-inning run in 35% of games, second-most in MLB, and holds that same rate against righties. With Angel Stadium playing slightly run-friendly at 102, the model's 52% scoreless sits well under the book's implied 59%.
- Coin flip — Cam Schlittler's 85% NRFI is the case for the under; the Los Angeles Angels' 35% first-inning bats (2nd-most in MLB) are the case for the over.
- Books price this NRFI at -165 (59% implied); the model has it 52%.
- The Los Angeles Angels score in the first in 35% of games, 2nd-most in MLB, 35% against right-handers.
- The New York Yankees score in the first in 28% of games, 21st-most in MLB, 34% against left-handers.
First-inning results graded from final box scores. Verdicts are informational, not betting advice.
Want full matchup analysis & AI picks? →
Pitcher arsenals, bullpen context, lineup splits, and AI-powered MLB prop analysis — free to start.
Get Started FreeOr browse today’s MLB games or MLB player props.